Renewable Milestones: From 2.8% to 43% in Two Decades
In a remarkable shift, the UK witnessed a transformation from 2.8% renewable energy in 2000 to a groundbreaking 43% in 2020, marking a significant leap in the nation’s green energy journey.
Interactive Insights: Navigating the UK’s Renewable Projects
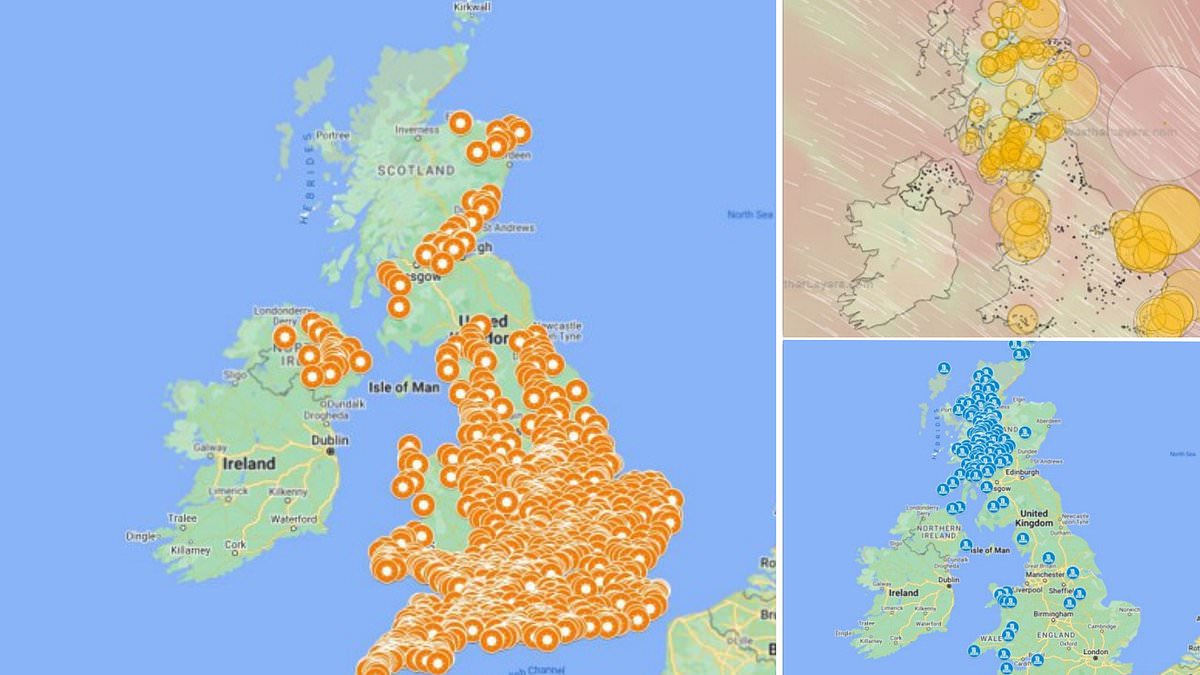
Explore the UK’s renewable energy projects through interactive maps, revealing the geographical spread of wind farms, hydroelectric stations, and solar farms. Gain a detailed understanding of the nation’s commitment to sustainable energy.
Wind and Solar Dominance: Capacity and Distribution Trends
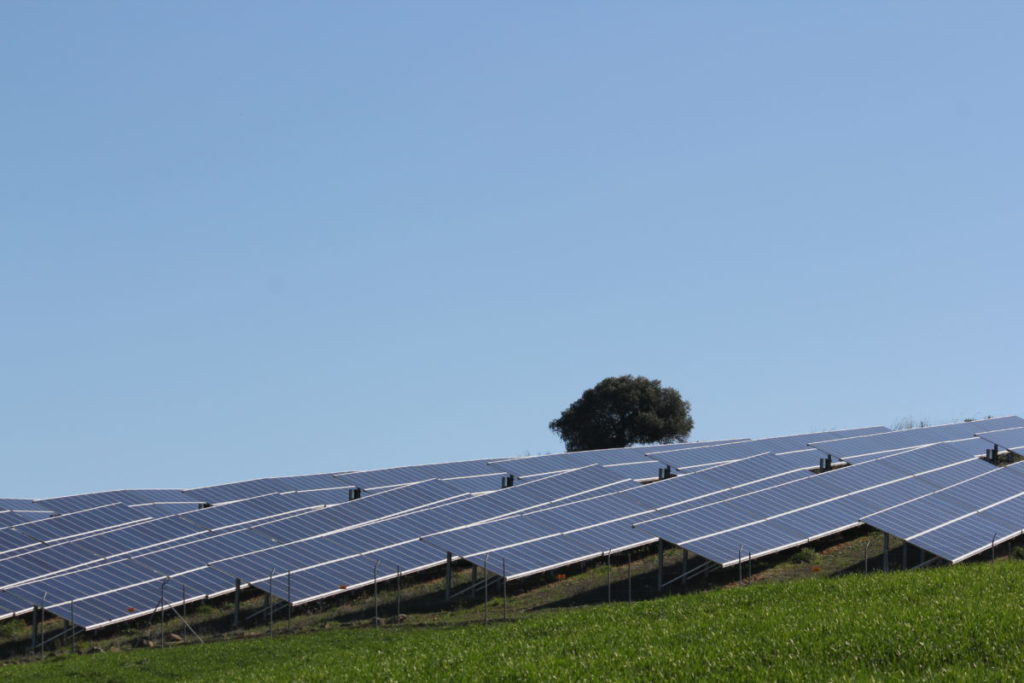
Wind power takes center stage, experiencing a 750% increase in electricity production between 2009 and 2020. The interactive map showcases the concentration of wind farms in Scotland and the South West. Meanwhile, solar power sees a surge, primarily in the sunny South of England.
Hydroelectric Dynamics and Future Prospects
While small hydroelectric projects contribute 148.9MW, larger ‘pumped storage hydroelectric’ projects in Scotland and Wales play a crucial role in storing excess renewable energy. The map hints at emerging potential in tidal and geothermal energy production, signaling a diverse and promising future for renewables.
In a bid to meet ambitious targets and lead the global renewables sector, the UK continues to innovate and diversify its renewable energy portfolio, embracing a sustainable and eco-friendly energy landscape.
Source:dailymail.co.uk